Santa Clara River Valley – Mound
Statistics
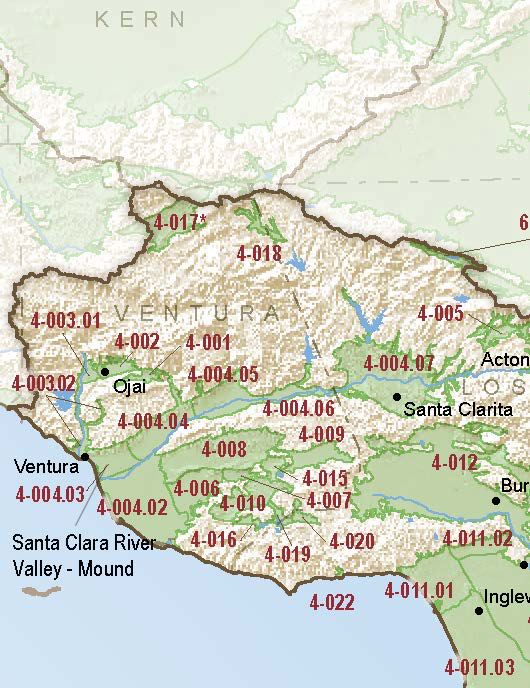
- Basin Name
- Santa Clara River Valley – Mound
- Basin Number
- 4-004.03
- SGMA Basin Priority
- High
- Critically Overdrafted
- No
- Hydrologic Region Name
- South Coast
- Counties
- Ventura
At-A-Glance
Located in California’s South Coast hydrologic region, the Santa Clara River Valley – Mound subbasin is 13,865.83 acres in size. This High priority basin is home to an estimated 75,298 people (2010 value). It has approximately 76 wells, of which approximately 1 are water supply wells. Groundwater accounts for approximately 56 percent of the basin’s water supply.
Basin Notes
2003: Bulletin 118 basin description
2014: CASGEM basin prioritization: medium
2018: Draft basin prioritization: high. Groundwater levels, salt intrusion and subsidence comments:
- Although groundwater levels in the Oxnard Plain area (Mound, Oxnard, Santa Paula, Pleasant Valley, & Las Posas Valley) have been relatively stable or have shown an increasing trend, in the coastal regions this stability is largely due to seawater intrusion and results in water of unusable quality replacing high quality groundwater. Rising groundwater levels in the Las Posas Valley are a result of active management to increase groundwater recharge beneath the Arroyo Las Posas. Seawater intrusion began in the Oxnard Plain area by 1930s and was widespread as early as the 1940s. Changes in groundwater management, including pumping reductions, shifting of pumping locations, construction of the Freeman Diversion, and the operation of the Pumping Trough and Pleasant Valley pipeline systems have significantly reduced seawater intrusion, but seawater intrusion conditions persist. Source: Central Coast Groundwater Seawater Intrusion and Other Issues, California Water Foundation
- 2) Water purveyors in the Piru, Fillmore, Santa Paula, Mound, and Oxnard subbasins include United Water Conservation District and Ventura County. United Water Conservation District operates surface water facilities to encourage groundwater protection through conjunctive use (UWCD 2012). Groundwater issues within the United Water Conservation District service area (which includes all of the basin) include overdraft conditions, sea water intrusion, and high nitrate concentrations. Source: Long Term Operation EIS, U.S. Bureau of Reclamation, Chapter 7
- Subsidence: According to the report (wri024136), Water-level declines in the basin have induced land subsidence that was first measured in 1939 and have resulted in as much as 2.7 feet land subsidence in the southern part of the Oxnard Plain. The model simulated a total of 3 feet of land subsidence in the southern part of the Oxnard Plain and as much as 5 feet in the Las Posas Valley subbasins. Model simulations indicate that most of the land subsidence occurred after the drought of the late 1920s and during the agricultural expansion of the 1950s and 1960s. The results also indicate that subsidence occurred primarily in the upper-aquifer system prior to 1959, but in the lower-aquifer system between 1959-93 owing to an increase in pumpage from the lower-aquifer system. Source: USGS; submitted via email to DWR, 10/21/2016 – Subsidence has been documented in the Oxnard Plain (USGS), 2) Two continuous GPS site in the basin (VNCO in Ventura and P729 near El Rio) showing recent subsidence Source: UNAVCO, 3) Ventura County predicts potential subsidence may be occurring, but has not investigated – County site, 2013 Ventura County General Plan – Hazards Appendix
2019: Basin boundary modification approved. It revised the shared boundary between the Mound and Santa Paula subbasins to align with the Santa Paula adjudicated boundary. The modification also revised the shared boundary between the Oxnard, Mound, and Santa Paula subbasins to align with the Fox Canyon Groundwater Management Agency’s boundary and the Santa Paula adjudication boundary. Draft basin priority: High
2021: December 31 – Groundwater Sustainability Plan (GSP) submitted to Department of Water Resources (DWR)
2023: October 26 – GSP approved by DWR