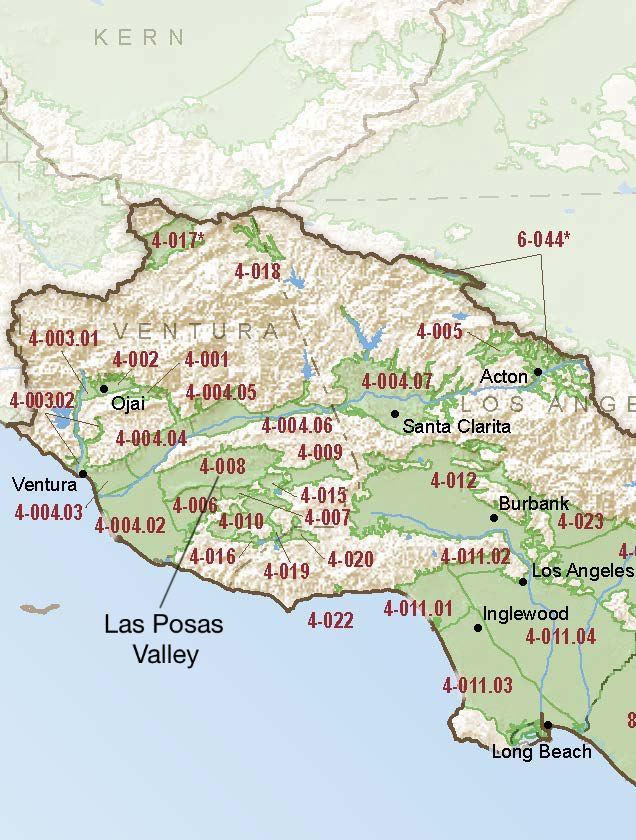
Las Posas Valley
Statistics
- Basin Name
- Las Posas Valley
- Basin Number
- 4-008
- SGMA Basin Priority
- High
- Critically Overdrafted
- No
- Hydrologic Region Name
- South Coast
- Counties
- Ventura
At-A-Glance
Located in California’s South Coast hydrologic region, the Las Posas Valley is 44,622 acres in size. This High priority basin is home to an estimated 42,721 people (2010 value). It has approximately 440 wells, of which approximately 20 are water supply wells. Groundwater accounts for approximately 81.07 percent of the basin’s water supply.
Basin Notes
2003: Bulletin 118 basin description
2011: Emergency Ordinance to Impose a Temporary Moratorium on New Wells, Fox Canyon Groundwater Management Agency
2013: Millions spent on California water-storage plan that leaks, Washington Post, 8/24/13
2014: CASGEM basin prioritization: high. Comment: TDS is generally high in this basin. PubCom includes reports of subsidence, overdraft and saline intrusion (chloride from adjacient basin?)
2016: Basin prioritization groundwater levels and salt intrusion comments –
- 1) CASGEM/WDL/GWIDS: Stable hydrographs. Source: DWR 2) Although groundwater levels in the Oxnard Plain area (Mound, Oxnard, Santa Paula, Pleasant Valley, and Las Posas Valley) have been relatively stable or have shown an increasing trend, in the coastal regions this stability is largely due to seawater intrusion and results in water of unusable quality replacing high quality groundwater. Rising groundwater levels in the Las Posas Valley are a result of active management to increase groundwater recharge beneath the Arroyo Las Posas.
- Seawater intrusion began in the Oxnard Plain area by 1930s and was widespread as early as the 1940s. Changes in groundwater management, including pumping reductions, shifting of pumping locations, construction of the Freeman Diversion, and the operation of the Pumping Trough and Pleasant Valley pipeline systems have significantly reduced seawater intrusion, but seawater intrusion conditions persist. Source: Source: Long Term Operation EIS, Chapter 7, U.S. Bureau of Reclamation (USBR)
- Subsidence – 1) According to Simulation of Ground Water-Surface Water Flow in the Santa Clara -Calleguas Basin, Ventura County, California (USGS), water-level declines in the basin have induced land subsidence that was first measured in 1939 and have resulted in as much as 2.7 feet land subsidence in the southern part of the Oxnard Plain. The model simulated a total of 3 feet of land subsidence in the southern part of the Oxnard Plain and as much as 5 feet in the Las Posas Valley subbasins. Model simulations indicate that most of the land subsidence occurred after the drought of the late 1920s and during the agricultural expansion of the 1950s and 1960s. The results also indicate that subsidence occurred primarily in the upper-aquifer system prior to 1959, but in the lower-aquifer system between 1959-93 owing to an increase in pumpage from the lower-aquifer system. Source: USGS; submitted via email to DWR, 10/21/2016 – Subsidence has been documented in the Oxnard Plain (USGS): 2) Two continuous GPS site in the basin (VNCO in Ventura and P729 near El Rio) showing recent subsidence Source: UNAVCO
Basin boundary modification with the Oxnard and Pleasant Valley subbasins
Revised basin boundary description